
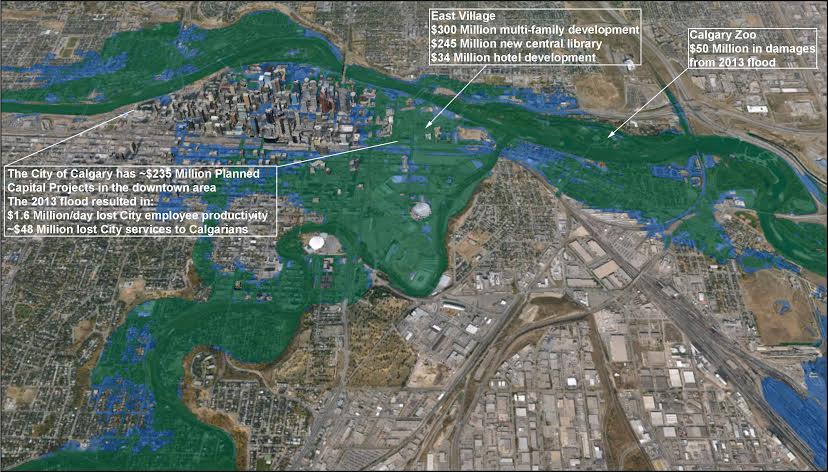
A comparison of the extent of flood inundation on the downtown core and inner city communities – green depicts inundation from the June 2013 flood, blue highlights additional areas that will be inundated by floodwaters if a flood of equal magnitude to the 1879 flood were to hit Calgary. Modeled with a peak flow value of 2265cms for the Bow River (data from Water Survey Canada archived hydrometric data and the City of Calgary) and a regression analyses applied between the Bow and Elbow Rivers to estimate a corresponding flow value of 894cms for the Elbow River. Visualization and modeling conducted by Alberta WaterSmart on behalf of the Calgary River Communities Action Group.